2022 Indianapolis CREDO Study
The 2022 CREDO student definitively showcases academic achievement and growth for students attending Innovation Network and charter schools in Indianapolis.
Stanford University’s Center for Research on Education Outcomes (CREDO) released a new study on academic performance of Indianapolis K-12 charter, innovation network, and traditional public schools. The study found learning gains for students in innovation network and charter schools compared to their local peers in district-run schools.
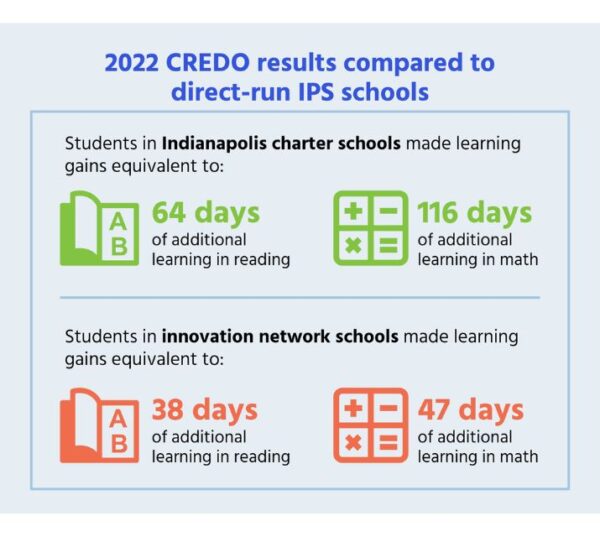
Data from the 2018-19 school year showed students in Indianapolis charter schools achieved growth equivalent to:
- 64 days of additional learning in English Language Arts (ELA)
- 116 days of additional learning in math relative to students at direct-run IPS schools
Meanwhile, students at Innovation Network Schools achieved growth equivalent to:
- 38 days of additional learning in ELA
- 47 days of additional learning in math relative to students in direct-run IPS schools

These results are especially notable when you consider that thousands more students attend autonomous schools in Indianapolis when this data was captured compared to the previous CREDO report that was released in 2019.
The results of the 2022 CREDO at Stanford University study show undeniable progress for Indianapolis charter and innovation network school students, particularly those students from historically marginalized communities.
Brandon Brown, CEO
Charter school performance compared to state average
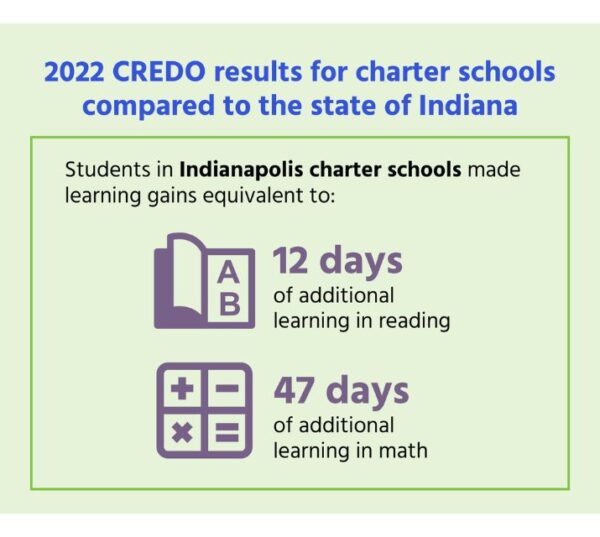
In 2018-19, Indianapolis charter school students achieved growth equivalent to 12 days of additional learning in ELA and 47 days of additional learning in math relative to students across Indiana. Students at Indianapolis charter schools now achieve more growth in reading and math across all subgroups compared to their statewide peers.

- Black students in charter schools achieved growth equivalent to
- 15 days of additional learning in ELA and
- 54 days of additional learning in math relative to the statewide public school average.
- Hispanic students in charter schools achieved growth equivalent to
- 27 days of additional learning in ELA and
- 46 days of additional learning in math relative to the statewide public school average.
- Low-income students in charter schools achieved growth equivalent to
- 19 days of additional learning in ELA and
- 51 days of additional learning in math relative to the statewide public school average.
- English Language Learner (ELL) students in charter schools achieved growth equivalent to
- 27 days of additional learning in ELA and
- 56 days of additional learning in math relative to the statewide public school average.
- Special education students in charter schools achieved growth equivalent to
- 6 days of additional learning in ELA and
- 46 days of additional learning in math relative to the statewide public school average.
Charter school performance compared to direct-run public schools in Indianapolis
Since the passage of the charter school law in 2001, Indianapolis charter schools have provided quality options for historically marginalized students. The results from the 2022 CREDO study once again demonstrate this success. In 2018-19:
- Black students in charter schools achieved growth equivalent to
- 86 days of additional learning in ELA and
- 144 days of additional learning in math relative to Black students in Indianapolis traditional public schools.
- Hispanic students in charter schools achieved growth equivalent to
- 73 days of additional learning in ELA and
- 109 days of additional learning in math relative to Latino students in Indianapolis traditional public schools.
- Low-income students in charter schools achieved growth equivalent to
- 63 days of additional learning in ELA and
- 112 days of additional learning in math relative to low-income students in Indianapolis traditional public schools.
- ELL students in charter schools achieved growth equivalent to
- 83 days of additional learning in ELA and
- 103 days of additional learning in math relative to low-income students in Indianapolis traditional public schools.
- Special education students in charter schools achieved growth equivalent to
- 30 days of additional learning in ELA and
- 118 days of additional learning in math relative to low-income students in Indianapolis traditional public schools.
Innovation network school performance compared to direct-run public schools in Indianapolis
Innovation network schools continue to lead students to better academic outcomes than their peers at traditional public schools in Indianapolis. In 2018-19:
- Black students in innovation network schools achieved growth equivalent to
- 69 days of additional learning in ELA and
- 80 days of additional learning in math relative to Black students in Indianapolis traditional public schools.
- Latino students in innovation network schools achieved growth equivalent to
- 11 days of additional learning in ELA and
- 10 days of additional learning in math relative to Latino students in Indianapolis traditional public schools.
- Low-income students in innovation network schools achieved growth equivalent to
- 40 days of additional learning in ELA and
- 45 days of additional learning in math relative to low-income students in Indianapolis traditional public schools.
- ELL students in innovation network schools achieved growth equivalent to
- 31 days of additional learning in ELA compared to Indianapolis traditional public schools.
- This subgroup achieved 8 less days of learning in math relative to ELL students in Indianapolis traditional public schools.
- Special education students innovation network schools achieved growth equivalent to
- 38 days of additional learning in ELA and
- 13 days of additional learning in math relative to low-income students in Indianapolis traditional public schools.
Social Media Toolkit
Help us spread the word about learning gains at Innovation Network and charter schools!
Why These Results Matter
These results definitively show that significantly more students, especially historically marginalized students, are getting a better education because of the growth of these school options in our city. The Mind Trust is grateful to the educators, supporters, and families who contribute to a shared goal of ensuring every student has access to a great school.
CREDO uses advanced technology and sophisticated statistical tools to measure students, schools, and the education landscape. They calculate the days of learning stats using the following methodology.
- CREDO calculates the average score for each state test on an annual basis by identifying a baseline student who scores exactly at the average multiple years running. The amount of year-to-year learning for that student shows the average learning for all students who took both tests.
- CREDO figures out the averages for every grade tested by the state.
- CREDO takes those annual measures of learning to represent a typical year of learning, which equates to a 180 day school year. The student who scored exactly average is said to have gained 180 days of learning.
- If a student makes more progress than the average student, CREDO uses the extra achievement and translates it into 180 days of learning plus “X” additional days. The size of “X” depends on how much more the student learned compared to the average student.
- The same is true for students who do not learn as much as the average student. Using the 180 day baseline, “X” days of less learning get subtracted. This results in students experiencing numbers like 165 days of learning as if they had not attended school for the entire year.
CREDO does not publish effect sizes for individual schools since the student populations at individual schools are not always large enough to be statistically significant. Thus, we do not have learning gains information pertaining to individual school performance.

